Sunday, October 16, 2016

New York City 311 Live Page

Thursday, September 15, 2016

A color map of school zones for New York City

Live Map See: https://city.tidalforce.org/eszone

For android phone go to https://city.tidalforce.org/eszoneandroid  (this will install a native viewer application if you do not already have it, and then show the map natively, which seems faster than the web version)


Tuesday, August 2, 2016

New York City Health Inspections Social Site

Try the "Go to My Location" button to see the resturant health inspection violations where you are.


Here's a map of where recent inspections are taking place: https://health.brooklynmarathon.org/nycsocialhealth.html


Here is a map that shows the clustering of health inspections in New York City: https://health.brooklynmarathon.org/nycsocialhealth-cluster.html


For details about recent inspections, see https://health.brooklynmarathon.org/

Here's a place where the latest New York City Health Inspections are shown and allow both customers and business owners to comment and discuss.


Sunday, June 26, 2016

A Tale of Two Cities: NYC School Poverty on a map

See https://city.tidalforce.org/nycschooldemographics.html

Source: http://schools.nyc.gov/NR/rdonlyres/20056B95-8351-4E45-B8A1-9901B4B6A93B/0/DemographicSnapshot201112to201516Public_FINAL.xlsx

This is the result of a demographics law see http://legistar.council.nyc.gov/LegislationDetail.aspx?ID=1946653&GUID=7329D54A-4E94-443D-9411-BCF5CC0C65D8&Options=&Search=

This page https://city.tidalforce.org/nycschooldemographics.html places the data on a map.  We cannot find a city published map of this data.

notice the ~0% poverty PS 321 next to very high poverty PS 282 etc


Beacon School One of the Best Test Scores and 85% poverty 

We can add the percent white to the map see: https://city.tidalforce.org/nycschooldemographics_show_race.html


Where the percent white is high the povery is low and vice versa

Notice in Park Slope, Brooklyn for instance, you'll see an inverse correlation between percent white and percent poverty.

Now you might believe that this is an issue that our Mayor De Blasio would address and he does.  Listen to https://www.youtube.com/watch?v=Ix0n2PnI--A&feature=youtu.be&t=41m50s


Title I Funding and Universal School Meals:

See https://city.tidalforce.org/nycschoolallocation_usm.html for a map of the meals program at your school.

If anyone knows what UC stands for please add a comment here
See https://city.tidalforce.org/nycschoolallocation_titlei.html for a map for Title I funding

Title I funding per child on a map
It is interesting to see that those schools that have more than 50% poverty but below the Title I funding threshold of 60% get much lower funding per child in poverty.  See PS 262 for an example.


Saturday, June 11, 2016

Unpaid Property Tax in New York City as of early 2016

See https://city.tidalforce.org/nycunpaidtax.html

This is only a subset of the entire list of unpaid NYC property taxes.  The rest is coming soon.

Please note this is based on NYC DOF http://nycprop.nyc.gov/nycproperty/nynav/jsp/selectbbl.jsp statements and since there is no API to the data, the information could have changed.  This is true as of 1st quarter NYC DOF statements.


Updated to include all early 2016 and late 2015 NYC tax bills.

unpaid property tax for late 2015 and early 2016

Herman Kraus Trust seems to lead the list with $20M in unpaid property tax and that is only for one of his properties.  See http://nycprop.nyc.gov/nycproperty/StatementSearch?bbl=3024090027&stmtDate=20160603&stmtType=SOA
See http://nypost.com/2015/03/03/nyc-targeting-tax-deadbeat-landlords/ also see http://legistar.council.nyc.gov/LegislationDetail.aspx?ID=2167163&GUID=9F81FD1F-5274-44CB-92EC-B4EA104D0EBE

Thursday, June 9, 2016

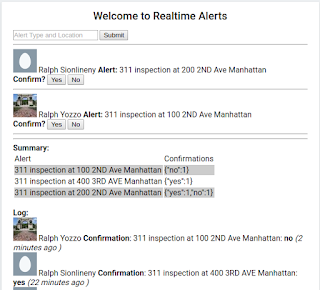
A simple real time alert and confirmation system

Let's say you are a restaurant owner and you want to know when the Health Inspector is in your neighborhood.

Let's say you are a resident and you want to know when something is happening in your neighborhood.

An instance of this alerting site can be set up for you.

Right now, it puts all the alerts in one place.  Each authenticated user can post one and only one alert.

Try it out and share the application link with your friends at https://classified.wsxnyc.org/alert/


Wednesday, May 25, 2016

See your property tax history and percentage change and compare to others.

See https://taxhistory.brooklyncoop.org/view1

This web application shows your New York City Property Tax history and the change in market value, assessed value and the assessment ratio.  Each of these values are dictated by our 1980's law.  See https://www.nysenate.gov/legislation/laws/RPT/1805

When the change by our New York City Department of Finance varies from the law it is highlighted.  The variation maybe caused by repairs or changes to your property.

This is a class 4 property that changes to a class 1B property

This highlights the variation from the law.
Check your own property or your neighbors.

We will add a tax prediction next.  Basically, your tax will increase by 20% every five years for Class 1 (1 to 3 Family Residential homes) and 30% every five years for other properties.


Thursday, May 12, 2016

Monday, May 9, 2016

One Million Recent New York City 311 Complaints updated daily on a map

For One Million Recent New York City 311 Complaints updated daily on a map, see http://bit.ly/nyc311latest and https://play.google.com/store/apps/details?id=com.brooklynmarathon.mapcityregister.nyc311


This is a map of the 311 complaints in NYC.

Red = recent
Green = ~ month old
Black = older.

Zoom in to see details.


Sunday, April 24, 2016

See your property tax bill relative to everyone else in New York City

If you have a one to three family home in New York City, see http://bit.ly/nyctaxequity to compare your property tax bill compared to everyone else.

For Class 2, 3, 4 (Coop, Commercial, and Utilities see http://bit.ly/nyctaxclass234)

For Android application, see https://play.google.com/store/apps/details?id=com.brooklynmarathon.mapcityregister.nycpropertytaxclass1  (press the compass icon to have the application go to your current location)

This is a map of the relative property tax assessment for 1 to 3 family homes in NYC.

Blue = Low (e.g, 1 or 2 percent),
Red = High (e.g.,4 to 6 percent).

What is Assessed Value?
This is a number that NYC Department of Finance assigns to your property in order to tax you.

What is Market Value?
This is the amount that NYC Department of Finance believes your house will sell for approximately.

What is Assessment Ratio?
This is your assessed value divided by your market value.

Please note that for class 1 property the assessment ratio target is 6 percent but thanks to real estate law https://www.nysenate.gov/legislation/laws/RPT/1805 the assessment cannot change by more than 6 percent per year and 20 percent per 5 year period

Park Slope is mostly blue = Low Assessment Ratio

Dyker Heights / Bayridge is mostly red = High Assessment Ratio

Monday, April 4, 2016

New York City Parking Rules on a Map

See https://cityregister.firebaseapp.com/mapparking.html for an interesting parking rules visualization.

For example,
show once a week vs. twice a week

Shows no street cleaning rules in Marine Park Area

Shows no street cleaning rules in Queens Howard Beach Area

Monday, March 28, 2016

New York State and New York City Traffic Tickets Analysis

Have you ever wondered how traffic tickets are organized in New York State?

Well please take a look at this: https://data.ny.gov/resource/q4hy-kbtf.json?$select=count(*)+as+count,violation_description&$group=violation_description&$order=count%20desc

You will see something like this:

[ {
  "count" : "1379346",
  "violation_description" : "SPEED IN ZONE"
}
, {
  "count" : "991612",
  "violation_description" : "DISOBEYED TRAFFIC DEVICE"
}
, {
  "count" : "839674",
  "violation_description" : "OPERATING MV MOBILE PHONE"
}


This link is straight from our data.ny.gov website.

This data shows the most popular VIOLATIONS used by our police force.

For interesting Violations see:


There are 1968 cases of BIKING OFF LANE NYC.  What violation is that?  Is it for a bicycle not biking in the bike lane?  That does not appear to be against our laws.

1968BIKING OFF LANE NYC


"Traffic Tickets Issued: Four Year Window"

Data extracted from records of tickets on file with NYS DMV. The tickets were issued to motorists for violations of: NYS Vehicle & Traffic Law (VTL), Thruway Rules and Regulations, Tax Law, Transportation Law, Parks and Recreation Regulations, Local New York City Traffic Ordinances, and NYS Penal Law pertaining to the involvement of a motor vehicle in acts of assault, homicide, manslaughter and criminal negligence resulting in injury or death.


Limitations:

This data set reflects only the issuance of traffic tickets. The data cannot be used to determine convictions, dismissals or other aspects of ticket disposition. The data does not include tickets issued in the five Boroughs of New York City for misdemeanor or felony violations. Examples are: — DWI/DWAI and aggravated unlicensed operation; — Penal Law offenses involving the use of a motor vehicle in acts of assault, homicide, manslaughter and criminal negligence resulting in injury or death; and — Tickets for non-misdemeanor/felony offenses that were issued during an arrest for a misdemeanor or felony violation.

Sunday, January 24, 2016

View NYC Recent Real Estate Sales

A NYC Register - updated each 30 days


Have you ever wanted to see all the recent New York City real estate transactions on a map.  I could only find limited version of this.  So I used MapBox GL and created one.  If you know of others, let me know.

See https://cityregister.firebaseapp.com/

recent changes to NYC Real Property
Choropleth of NYC Real Property Changes


This data is up to date as of the end of the month.


At this point in time, the NYC Real Property dataset is updated Jan 8, 2016 but the data only includes information from the end of the previous month (in this case, Dec 31, 2015)

If you want, daily updates of this public information you will have to pay $172,270.00


So if you want all the public data including document images and digital "meta" data for a year for all locations it would be $172,270.00


See http://acris.nyoss.com/SDS/Overview/How%20To%20Process%20ACRIS%20Daily%20File%20v1%207.htm for instructions from NYC DOF for processing their "Daily File"

But the https://cityregister.firebaseapp.com/ link gives you the digital data but it is delayed by 1 to 30 days plus about a week (NYC DOF upload delay) for much lower cost.

One question, why is the NYC DOF upload process not run every day?  It appears it would cost very little since the update process already exists.